Insert layout attribute table |
  
|
Insert layout attribute table |
|
![]()
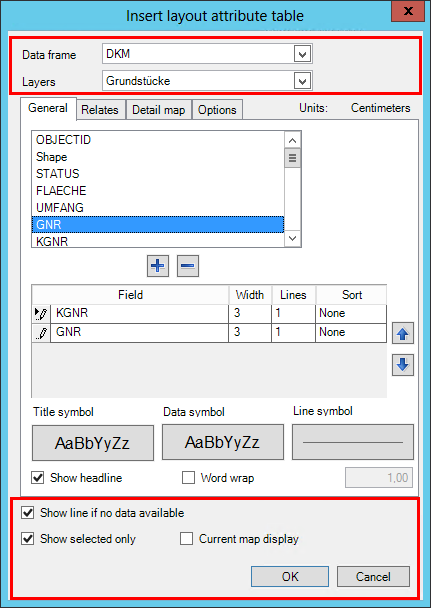
Set multiple attribute columns for the representation of a table of a configured layer. In addition to attributes, it is possible to display fields of relates and detail maps as graphics.
Since WebOffice 10.6 R2 SP2: Fields containing Domains/Subtypes the description instead of the code is displayed.
Note: Layout attribute tables can only be inserted in the layout view.
Menu Item |
Description |
Data frame |
The drop down menu lists all available data frames of the current map document (.mxd). Choose the data frame that includes the layer on which you want to define the layout attribute table. |
Layer |
The drop down menu lists all available layer of the selected data frame. Choose the layer for which you want to define the layout attribute table. |
Show line if no data available |
If there are no data available for the configured layout attribute table, a black dashed line is displayed as place holder.
This option is enabled by default. If this line should not be displayed, the option can be disabled. |
Show selected only |
Only the selected features are displayed in the layout attribute table. This option can be used, if you for instance want to display the parcel numbers of the selected parcels. This option is valid for all register (General, Relates, Detail map, Options). |
Current map display |
All features of the current map display are displayed in the layout attribute table. This option is valid for all register (General, Relates, Detail map, Options). |
OK |
After confirming the dialog, the layout attribute table is inserted as graphic element. The graphic element can be placed and aligned at will. In contrast to the layout attribute, the layout attribute table lists the attribute values directly, when inserting the table. Without calling the Update graphics function |
Cancel |
No layout attribute table is inserted. |