GeoOffice ePaper designer |
  
|
GeoOffice ePaper designer |
|
Q: Is the number of certain values of a data column added? I would like to add the number of properties in the cadastral community 91119.
A: For this following steps are necessary:
•Insert the desired field (KG number) into the footer of your data.
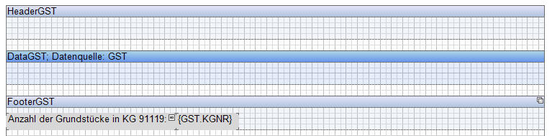
•Click on Edit to edit the text element {GST.KGNR}. The Text Editor opens. In the Text Editor toggle to the category Summary.
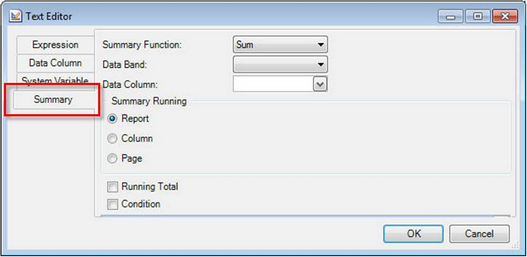
•As function select Count. The Data Band determines the table. The Data Column is the field you would want to calculate the number for. Enable the option Condition and click on the button with ... .
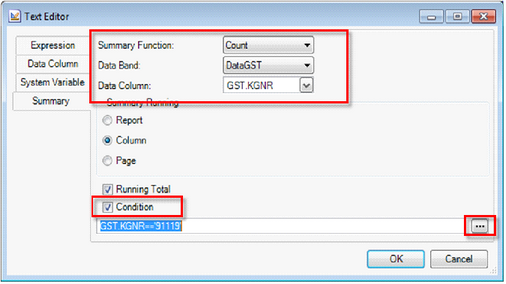
•There you can define you conditions, such as GST.KGNR==“91119“. A value is compared here, therefore 2 = are quoted.
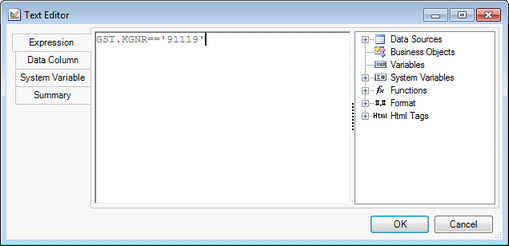
•The expression and the result now look like this:
![]()
![]()
Q: In the chart all decimal places of the numerical field are displayed. How can the decimal places be reduced to two?
A: The format of the numbers in the chart is set with the attributes "format" in the properties of the Series Labels.
Click on the chart. Under the Tab Properties you find under the 1. chart the sub-item Series Labels. This contains the attribute format, where the decimal places can be defined. N2 for instance is for two decimal places.
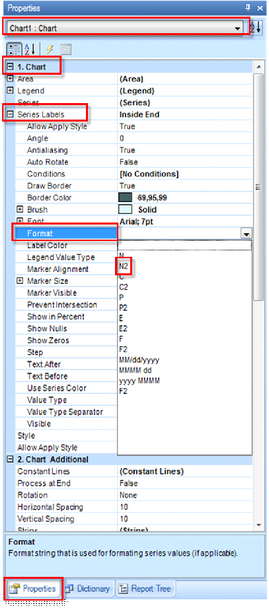
Defining decimal places in the chart.
Q: I would like to use a custom color scheme in the chart. How does this work?
A: To be able to use a customized color scheme with the chart wizard, this color scheme has to be previously defined with the Style Designer.
For this open the Style Designer in the designer.

In the Style Designer add a new style with Add New Style (1). Select Chart, since you would like to define the style of a chart.
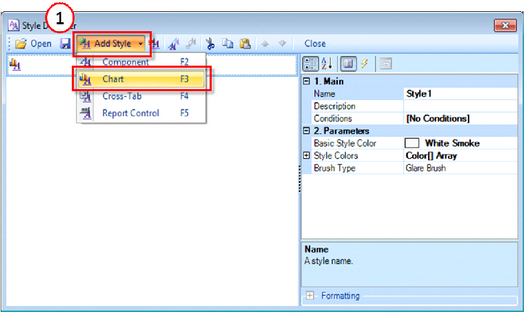
Add New Chart Style
Define a name for your style. The colors are defined with the attribute Style Colors. For this click on Color[] Array.
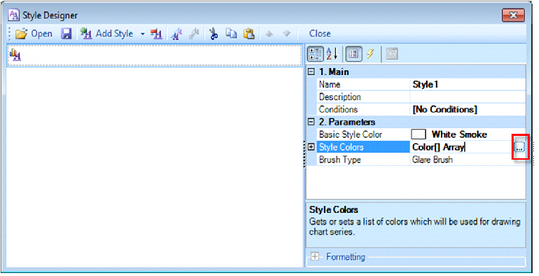
Define Color Array
In the Color Collection Editor you can define the colors. The color can be either selected from a predefined list or defined directly with RGB values.
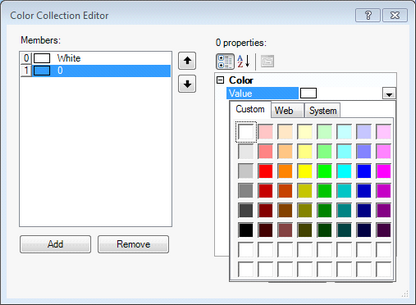
Color Collection Editor
After defining the colors, close the Color Collection Editor.
Now you have the possibility to save the style. However this is not mandatory.
Close the Color Collection Editor.
If you insert now a new chart, the style defined by you will be automatically listed in the Chart Wizard.
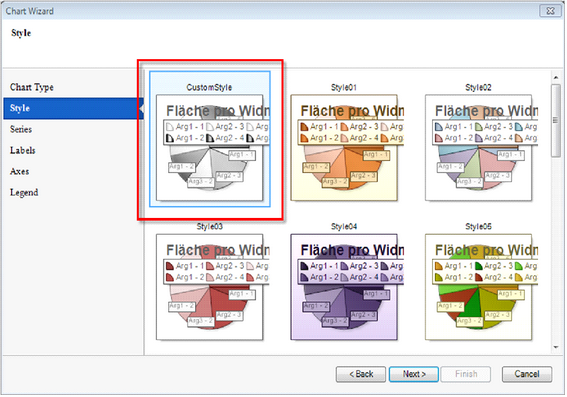
Customized style in the chart wizard
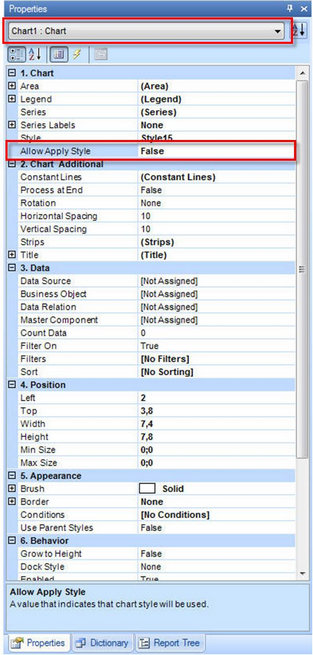
Q: I am making changes under chart properties, such as changing the color range, background color, and border settings. The chart settings are however reset again and again to the default settings. Why?
A: To accept the changes, the attribute Allow Apply Style in the Chart Properties must be set to FALSE.
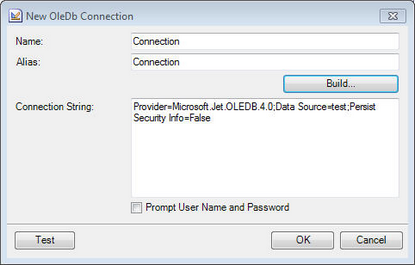
Q: Why is the Connection String not correctly displayed with a OleDB Connection on a SQL database with a SQL Server Native Client 10.0? The Connection to the SQL server and to the database was correctly created. The connections string looks like this:
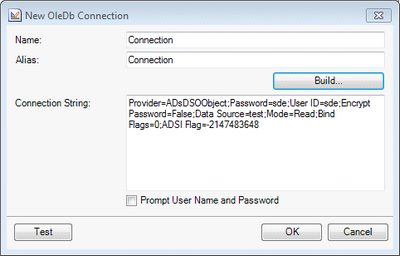
A: When the connection with this connection string is checked with Test, the note appears:
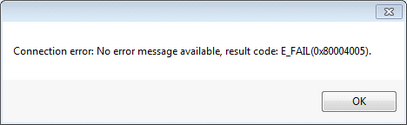
Several redundant parameters are in the connection string. These can be deleted. These are all the parameters that contain empty fields "". Besides the parameter Password is missing for password in the connection string. Add this retroactively. For the connection to work smoothly, the connection string must look like this.
You can find more information about creating Connection Strings at http://www.connectionstrings.com/.
Q: I have built an ODBC connection on an Oracle database. The table can be added. However no attributes (columns) are shown in the table. How can I add those?
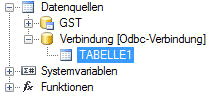
A: The attributes (columns) can be added retroactively. For this click on the table (TABELLE1) and on Edit ![]() . The Edit Data Source dialog opens. In the dialog it is obvious that the table is indeed prompted however the columns are not retrieved.
. The Edit Data Source dialog opens. In the dialog it is obvious that the table is indeed prompted however the columns are not retrieved.
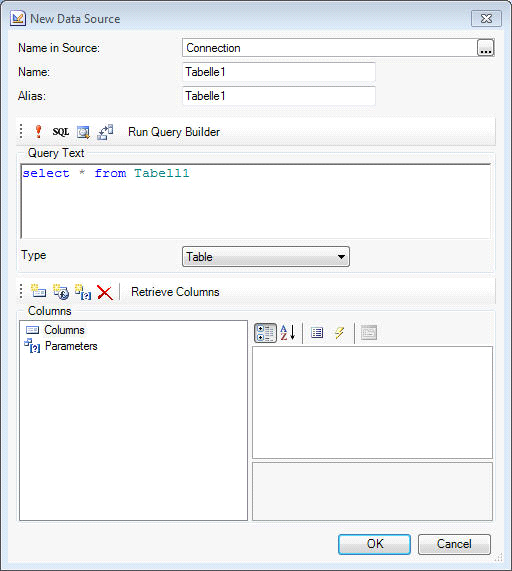
Edit Data Sources
Click on the button Retrieve Columns. Thereby the columns are added and are now available for further steps.
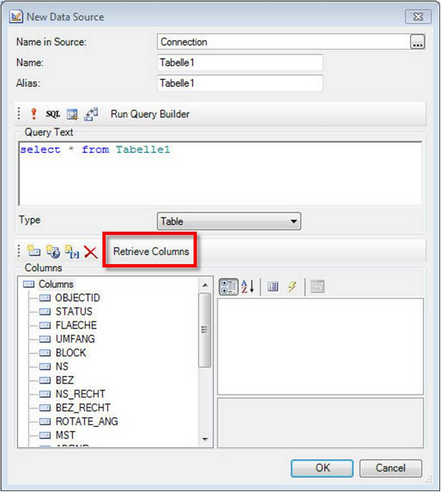
Edit Data Sources
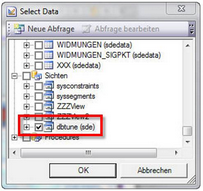
Q: When trying to build a SQL connection on a SDE view with the connection type SQL connection, an error occurs. When selecting the data source, the view is selected.
The view is selected. The name contains the scheme name.
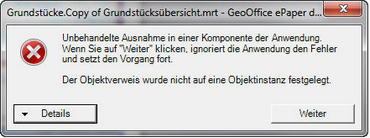
If you want to see now a preview of the data with "View Data", an error message appears:
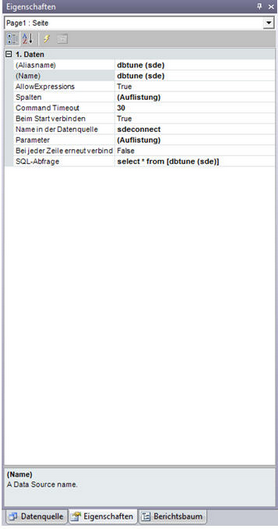
A: Under the properties of the view the SQL query is checked. This is faulty select * from [dbtune (sde)].
The query is created incorrectly. It would be correct: select * from sde.dbtune
Since the authentication to the SQL server was already done when building the connection, it is not necessary to quote the scheme (the owner) to the view. ->select * from dbtune
The solution of the problem is therefore:
1. Wither changing the SQL query -> either by owner or only the tables or view name.
2. When building the connection you should not select the type SQL connection but an OleDB connection with e.g. a SQL server client. When this connection type is selected, the query is always done correctly on the table and the views -> that is without the scheme.
Q: The cell width can change dynamically in the tables, according to the length of the field value in the cell?
A: Yes, this is possible. This is controlled with the table attribute Auto Width. The value is set by default to None. It must be however set to Page - than the size of the cell is adjusted per page.
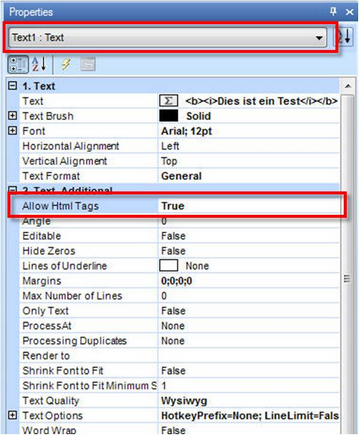
Q: Within a text expression I am using a HTML tag. It is however not recognized as HTML tag.
<b><i>This is a test</i></b>
![]()
A: For a HTML tag to be recognized as one, the text attribute Allow HTML Tags must be set to True.
![]()