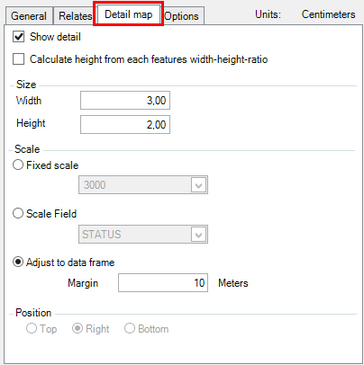
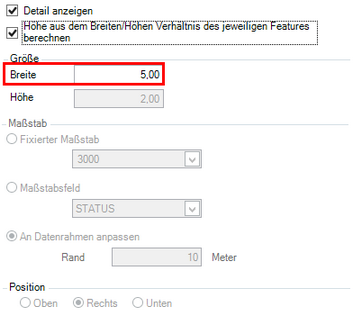
Tab "Detail map"

It is possible to display a detail map for each row of the table.
Menu |
Description |
||
|---|---|---|---|
Show detail |
Enable the option to display the Detail map. |
||
Calculate height from each features width-height-ratio |
Depending on the size of the feature (depends on chosen dataframe and layer), the height is calculated automatically. The width of the detail map is defined by the user. The height is calculated from the width-height-ratio of the represented feature. If this option is enabled, it is not possible to define a scale fort he detail map. This option applies only to polygon features.
|
||
Size |
Width and height of the detail map (in centimeter). |
||
Scale: |
|||
Fixed scale |
The detail map is displayed with a fixed scale. Don’t use this option, if the size of the features has a wide range. |
||
Scale field |
The map scale is dynamically set by a scale field. |
||
Adjust to data frame |
Objects are adjusted to the size of the defined rectangle. The map scale is set automatically and it is possible to set the distance of the objects to the border (in meters). This option displays every object in a different map scale. |
||
Position |
Defines the position of the detail map inside the row of the table. |
||

|
The dashed red line at the end of the layout attribute table indicates, that not all of the selected features can be displayed. This means that the defined size of the layout attribute table is too small for the amount of selected features. |