Insert New Data Source

Insert a new data source (1) in the tab Dictionary.
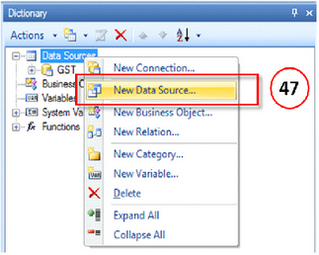
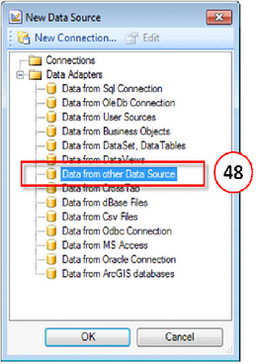
For the connection, select the connection Data from other Data Source (2).
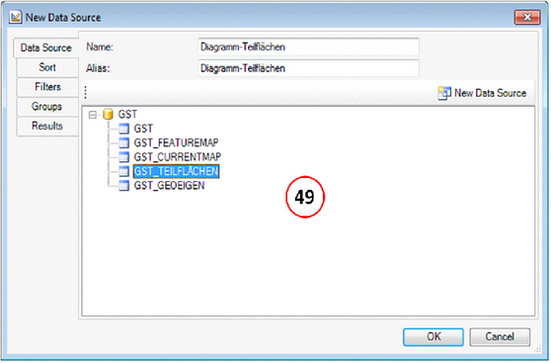
Change the name and the alias (e.g. Diagramm_Teilflächen) of the new data source. In the next step select the data source that you want to edit from (49).
Change to the category Groups (50) and add a new group with Add Group (51). From the list Column select the argument from the selected data source that you have previously chosen as argument for the chart. In the columns selection list all fields of the previously selected data source are automatically quoted. The Direction defines how the field is sorted.
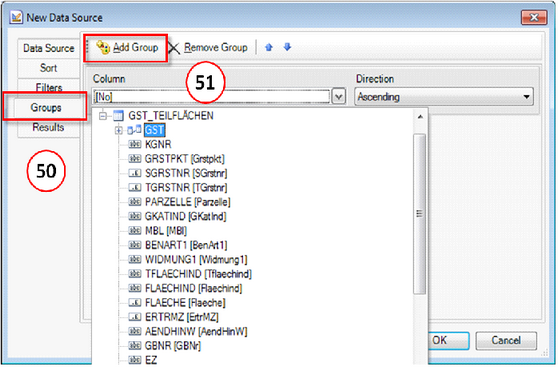
In this example the argument ARTLANG which contains the information about the dedication categories is selected as column.
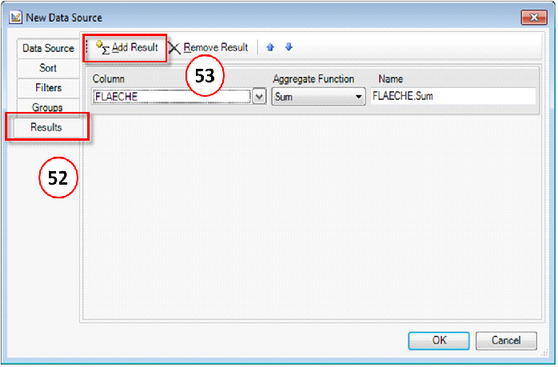
Change next to the category Results (52) and add a new result with Add Result (53). From the list Column select now the value that you also selected previously for the chart representation.
Furthermore select the desired Aggregate Function.
In this example the column SURFACE is selected. The sum of the surface should be displayed for each argument, i.e. for each dedication category. Therefore the aggregate function Sum is selected.
The dialog is closed with OK. The new data source is now listed with the two fields in the tab Dictionary.