Diagramm - Change Color Scheme

I would like to use a custom color scheme in the chart. How does this work?
To be able to use a customized color scheme with the chart wizard, this color scheme has to be previously defined with the Style Designer.
For this open the Style Designer in the designer.

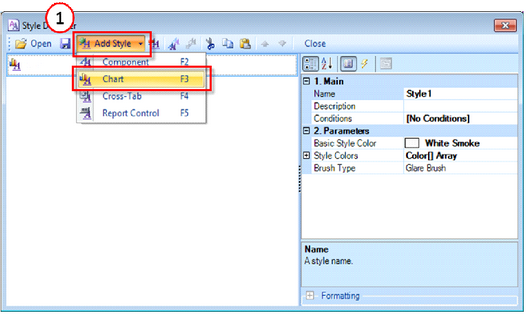
In the Style Designer add a new style with Add New Style (1). Select Chart, since you would like to define the style of a chart.
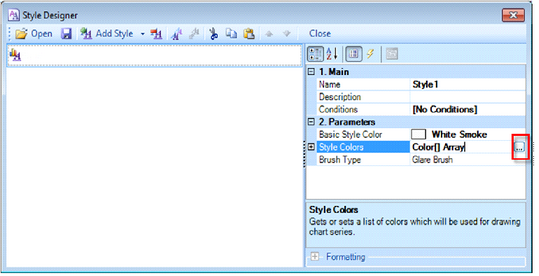
Define a name for your style. The colors are defined with the attribute Style Colors. For this click on Color[] Array.
In the Color Collection Editor you can define the colors. The color can be either selected from a predefined list or defined directly with RGB values.
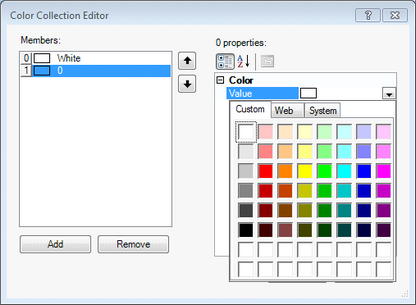
After defining the colors, close the Color Collection Editor.
Now you have the possibility to save the style. However this is not mandatory.
Close the Color Collection Editor.
If you insert now a new chart, the style defined by you will be automatically listed in the Chart Wizard.

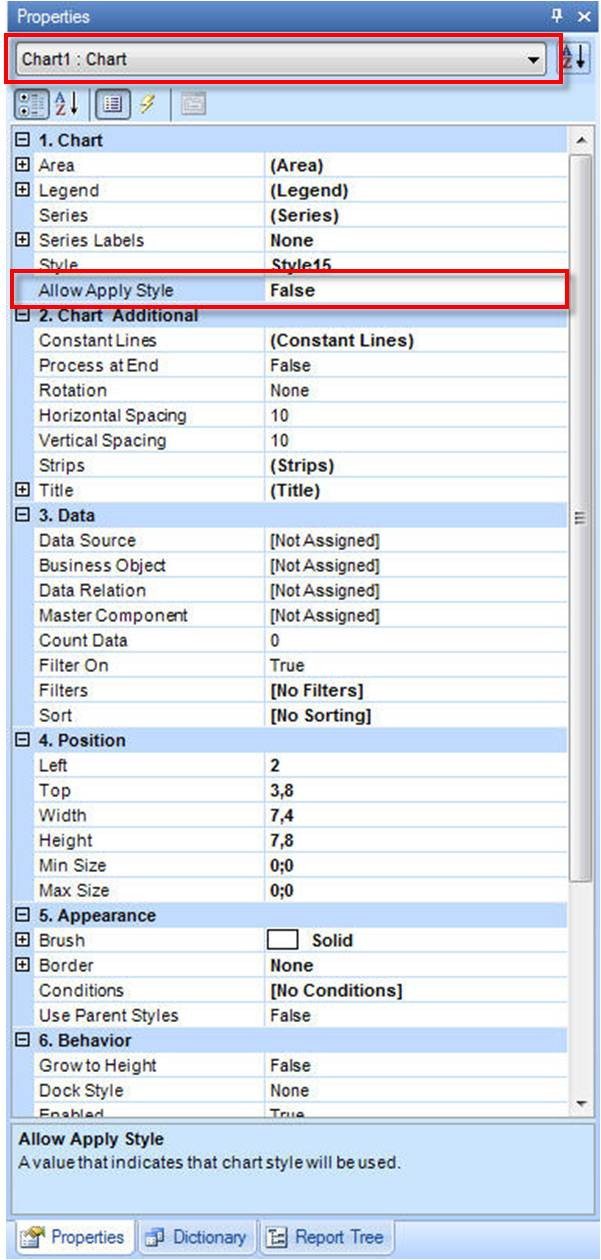
I am making changes under chart properties, such as changing the color range, background color, and border settings. The chart settings are however reset again and again to the default settings. Why?
To accept the changes, the attribute Allow Apply Style in the Chart Properties must be set to FALSE.