Change Chart Settings

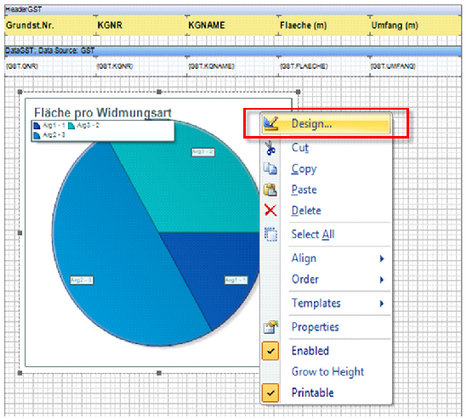
Now the new defined fields from the new data source must be still changed in the chart. For this click the chart and right-click on Design. Edit chart...
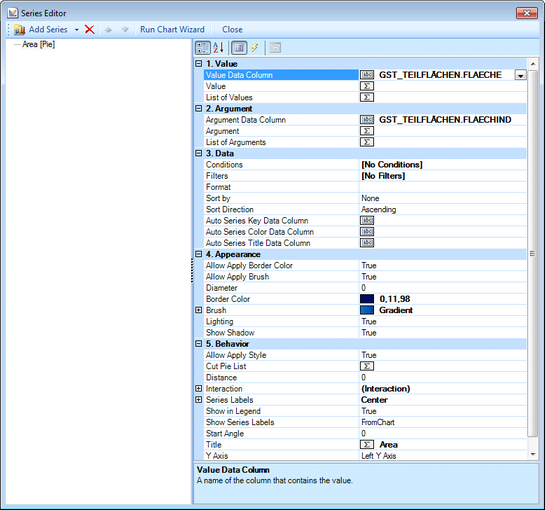
Thereby the series editor is started. With the series editor you have a dialog where you can subsequently make your chart settings such as display, behavior of the legend and of the axes or changes of the arguments and values.
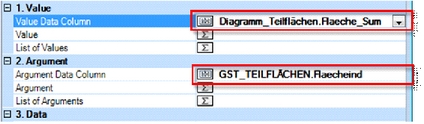
In this example the Argument Data Column from the data source GST_TEILFLÄCHEN.ARTLANG is changed to the new data source Diagramm_Teiflächen.ARTLANG. The Value Data Column is changed from GST_TEILFLÄCHEN.FLAECHE to the new data column Diagramm_Teiflächen.FLAECHE_Sum.
The Series editor is closed with Close. The changes are now complete.
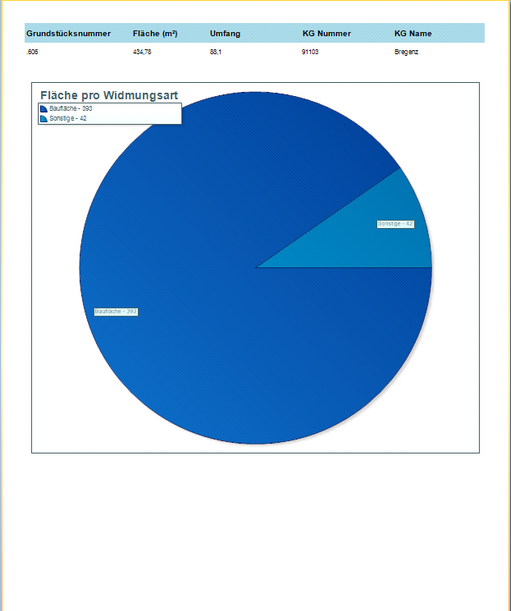
With Preview you can see how the chart is currently displayed. In the partial surface example the arguments are summarized now into identical categories. The surface is added up.